
Data Analyst Roadmap 2026: A Step-by-Step Guide for Freshers
By Elearn Infotech Career Guidance Team, with input from our data trainers · Updated
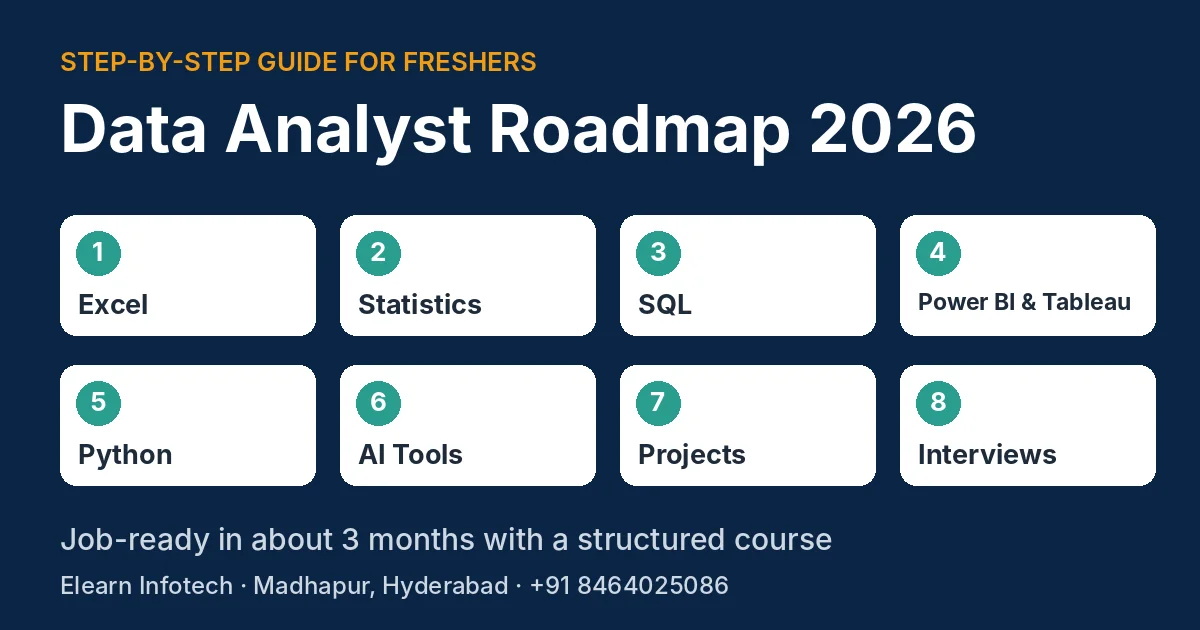
Quick answer: To become a Data Analyst in 2026, learn these skills in this order: Excel, basic statistics, SQL, Power BI or Tableau, Python and AI tools for analytics. Then build 4–5 real projects, prepare a simple portfolio and practise interviews. With a structured course and daily practice, most freshers become job-ready in about 3 months. Learning alone usually takes longer.
Many freshers want to become Data Analysts but don't know where to start. Some jump straight into Python, others collect certificates without building anything. This data analyst roadmap shows what to learn, in which order, and how long each step takes, so you don't waste months on the wrong things. It works whether you studied B.Tech, B.Com, BSc, BBA or any other degree.
The Roadmap at a Glance
| Step | What to learn | Why it matters | Time (with a course) |
|---|---|---|---|
| 1 | Excel | Most companies still start their data work in Excel | 2 weeks |
| 2 | Basic statistics | Helps you read data correctly and avoid wrong conclusions | 1 week |
| 3 | SQL | The main way to get data out of company databases | 2–3 weeks |
| 4 | Power BI and Tableau | Turn data into dashboards managers can understand | 2–3 weeks |
| 5 | Python for data analysis | Handles larger data and repeat tasks faster | 2–3 weeks |
| 6 | AI tools for analytics | Speeds up data cleaning, SQL and reports | Along the way |
| 7 | Projects and portfolio | Proof of your skills for interviews | Throughout |
| 8 | Resume and interview practice | Helps you turn skills into a job offer | Last 2 weeks |
Step 1: Start with Excel
Excel looks simple, but it is where most data jobs begin. Many companies share reports in Excel every day, and interviewers often test it first.
Learn: sorting and filtering, formulas such as IF, SUMIFS and COUNTIFS, VLOOKUP and XLOOKUP, pivot tables, charts and basic data cleaning.
Practice idea: take a sample sales sheet and find the top 5 products, the best month and the weakest region using a pivot table.
Step 2: Learn Basic Statistics
You don't need to be a maths expert. You need to understand averages, median, percentages, spread (standard deviation) and correlation. These help you check whether a change in numbers is real or just random.
Tip: learn each idea with a business example, such as "average order value" or "monthly growth", instead of only formulas.
Step 3: Learn SQL
SQL is one of the most common skills asked for in Data Analyst job descriptions. Company data lives in databases, and SQL is how you get it out.
Learn: SELECT, WHERE, ORDER BY, GROUP BY, JOINs, subqueries and basic window functions.
Practice idea: write queries to find repeat customers, monthly revenue and the top-selling product in each city.
Step 4: Build Dashboards in Power BI and Tableau
Managers rarely read raw tables. They want a clear dashboard they can understand in a minute. Power BI is widely used in Indian companies, and Tableau is common too, so it helps to know both.
Learn: connecting to data, cleaning it with Power Query, creating charts and filters, basic DAX measures and designing a clean one-page dashboard.
Practice idea: build a sales dashboard showing revenue by month, region and product, with filters.
Step 5: Learn Python for Data Analysis
Python helps when data is too large for Excel or when you repeat the same task every week. You don't need to become a software developer. Focus on the data side.
Learn: Python basics, Pandas for cleaning and grouping data, and Matplotlib for simple charts.
Practice idea: clean a messy CSV file with missing values and duplicates, then summarise it by category.
Step 6: Use AI Tools the Right Way
In 2026, analysts use AI tools to draft SQL queries, clean data and write report summaries faster. That is a useful skill, but only if you can check the output. AI tools sometimes write queries that run but give the wrong answer. Learn the basics first, then use AI to work faster, not to think for you.
Step 7: Build Projects and a Simple Portfolio
Projects matter more than certificates. In interviews, you will be asked what you built, what problem it solved and what you found.
Project ideas:
- Sales performance dashboard (Excel and Power BI)
- Customer analysis using SQL (repeat buyers, top cities)
- HR attrition analysis (why employees leave)
- Website or marketing data analysis
- Data cleaning and summary report with Python
Keep each project short and clear: the question, the data, what you did and what you found. Share them on GitHub or in a simple PDF portfolio.
Step 8: Resume, Interviews and Applying
Put your skills and projects at the top of your resume, not your hobbies. Practise common interview tasks: writing SQL queries, explaining a dashboard, and solving a simple Excel case. Apply for roles such as Data Analyst, MIS Analyst, Business Analyst (junior) and Power BI Developer.
Real Student Story
Kranthi, a B.Tech graduate, joined our Data Analytics course and is now working as a Data Analyst.
5 Mistakes to Avoid
- Starting with Python before Excel and SQL. Most analyst work happens in Excel, SQL and Power BI first.
- Collecting certificates without projects. Interviewers ask what you built.
- Watching videos without practising. Spend more time doing than watching.
- Ignoring communication. If you can't explain your findings simply, the analysis loses value.
- Copying AI output without checking it. Always test queries and numbers yourself.
Learn Alone or Join a Data Analytics Course?
You can learn on your own with free videos, and some people do. But many freshers lose time jumping between topics, get stuck without help, and finish without real projects. A structured course gives you the right order, a trainer to clear doubts, projects with feedback and interview preparation. Choose what fits your discipline, budget and timeline.
Data Analytics Course in Hyderabad at Elearn Infotech
If you want to follow this roadmap with a trainer, our Data Analytics course in Hyderabad covers every step above: Advanced Excel, statistics, SQL, Power BI, Tableau, Python and AI tools for analytics.
- Duration and fee: 3 months, ₹25,000
- Projects: 5 real-time projects
- Trainer: Mr. Sagar, Data Scientist with 8+ years of experience at MNCs
- Mode: classroom training in Madhapur, near Hitech City, or live online training
- Placement: placement assistance, including resume preparation, mock interviews and referrals
Students join our Madhapur classes from Gachibowli, Kondapur, Kukatpally, KPHB, Ameerpet and Secunderabad. Want to go further into prediction and machine learning later? See our Data Science course.
Frequently Asked Questions
How do I become a Data Analyst in 2026?
Learn Excel, basic statistics, SQL, Power BI or Tableau, Python and AI tools for analytics, in that order. Build 4–5 real projects, prepare a simple portfolio and practise interview tasks such as SQL queries and dashboard explanations.
How long does it take to become a Data Analyst?
With a structured course and daily practice, most freshers become job-ready in about 3 months. Learning on your own usually takes longer, often 4 to 6 months, depending on your time and discipline.
Can a fresher become a Data Analyst?
Yes. Data Analyst is one of the most common entry roles in data. Freshers with Excel, SQL, Power BI and a few strong projects can apply for Data Analyst, MIS Analyst and junior Business Analyst roles.
Can a non-IT graduate become a Data Analyst?
Yes. Many Data Analysts come from B.Com, BBA, BSc and other non-IT degrees. The tools can be learned from the basics, and business knowledge is an advantage.
Should I learn Python or SQL first for data analytics?
Learn SQL first. Most analyst work starts with getting data from databases, and SQL is asked in most Data Analyst interviews. Add Python after you are comfortable with Excel and SQL.
Is Power BI or Tableau better for a Data Analyst?
Both are useful. Power BI is widely used in Indian companies, and Tableau is also common. Learn one well first, then the other; the dashboard skills carry over.
What projects should a Data Analyst fresher build?
Good starter projects are a sales dashboard, a customer analysis using SQL, an HR attrition analysis, a marketing data analysis and a data cleaning report with Python. Explain the question, data, method and findings for each.
What is the Data Analytics course fee in Hyderabad at Elearn Infotech?
The Data Analytics course at Elearn Infotech, Madhapur is ₹25,000 for 3 months, with 5 real-time projects and placement assistance, in classroom and live online modes. It covers Advanced Excel, statistics, SQL, Power BI, Tableau, Python and AI tools for analytics.
Related: Data Analyst vs Data Scientist: Which Career Should You Choose? · Which Software Course Should a Fresher Choose in 2026?
Note & About this Guide
This guide was written by the Elearn Infotech career guidance team in Madhapur, Hyderabad, based on how our trainers teach data analytics to freshers and the questions students ask us at counselling. Course fees, durations and project counts are correct as of November 2026; please call us for the latest batch details.